Homework 11
Please read chapter 22 The Commerce of XML, 23 Simultaneous Processing, and 24 Summary in the textbook.
Be sure to include type, purpose, definition and tests for all functions.
Include the following at the top of your homework:
#lang typed/racket

(require "../include/uchicago151.rkt")
(require typed/test-engine/racket-tests)
(require typed/2htdp/image)
And include (test) at the bottom of your homework.
Problem 1
Use the following structure for expression trees:(define-struct BinOp ([op : (U 'Plus 'Times)] [lsub : ExpTree] [rsub : ExpTree])) (define-struct UnOp ([op : (U 'Negate 'Sqrt)] [sub : ExpTree])) (define-type ExpTree (U Number UnOp BinOp))
We will use the above type ExpTree to represent an expression tree of numbers. A ExpTree can be one of three things: a Number, a unary operation with one subtree or a binary operation with two subtrees (left and right). Each operation is represented by a symbol:
- 'Negate is negation (for example, (- 5) is (UnOp 'Negate 5))
- 'Sqrt is square root (for example, (sqrt (- -5)) is (UnOp 'Sqrt (UnOp 'Negate -5))
- 'Plus is addition (for example, (+ 4 (sqrt 9)) is (BinOp 'Plus 4 (UnOp 'Sqrt 9))
- 'Times is multiplication (for example, (* (- 4) (+ 5 9)) is (BinOp 'Times (UnOp 'Negate 4) (BinOp 'Plus 5 9))
Using these structures, write the following functions:
- (: eval (ExpTree -> Number)) should evaluate the function
- (: leaves (ExpTree -> (Listof Number))) should output a list of the leaves of the tree in order from left to right
- (: num-ops (ExpTree -> Nonnegative-Integer)) should compute the total number of operations in the tree
- (: height (ExpTree -> Nonnegative-Integer)) should compute the height of a tree, which is defined as the length of the longest path from the root of a tree to any leaf. For example, the height of the tree with just a single node is zero, and the height of the tree (BinOp 'Times (UnOp 'Negate 4) (BinOp 'Plus 5 9)) is 2
- (: infix-string (ExpTree -> String)) should produce a string representation of the expression using infix notation, for example (infix-string (BinOp 'Times (UnOp 'Negate 4) (BinOp 'Plus 5 9))) should be "((- 4) * (5 + 9))". Note that this can be done with an inorder traversal of the tree.
- (: prefix-string (ExpTree -> String)) should be just like infix-string but with prefix notation instead of infix notation, for example (infix-string (BinOp 'Times (UnOp 'Negate 4) (BinOp 'Plus 5 9))) should be "(* (- 4) (+ 5 9))". Note that this can be done with a preorder traversal of the tree.
Problem 2
You will also need the following batch of data structures:
(define-struct Empty ())
(define-struct (Node A)
  ([value : A]
   [lsub : (BST A)]
   [rsub : (BST A)]))

(define-type (BST A) (U Empty (Node A)))
Write the following functions on polymorphic binary search trees. Use the structures and types above.
- (: list->tree (All (A) ((A A -> Boolean) (Listof A) -> (BST A)))) that takes as input a list and an ordering function and produces as output a binary search tree.
- (: tree->list (All (A) ((BST A) -> (Listof A)))) that takes as input a binary search tree and outputs a sorted list.
- (: bst-height (All (A) ((BST A) -> Nonnegative-Integer))) takes a tree as input and determines it's height. The height of the empty tree is zero and the height of a single node is one, etc.
- (: depth (All (A) ((A A -> Boolean) A (BST A) -> Nonnegative-Integer))) takes an ordering function, an element, and a binary search tree and outputs the depth of the element, if it exists. The depth of some value is the number of nodes from that value to the root of the tree. For example, the depth of the root node is one, the depth of its children are two, the depth of its grandchildren is three, etc. Use "equal?" to test equality.
- (: perfectly-balanced (All (A) ((BST A) -> Boolean))) that determines if a tree is perfectly balanced. A tree is perfectly balanced if every path from the root to a leaf has exactly the same length. Equivalently, a tree is perfectly balanced if all the leaves have the same depth.
- (: mostly-balanced (All (A) ((BST A) -> Boolean))) that determines if a tree is balanced by the following definition: a tree is balanced if the height of it's subtrees is different by at most one and both subtrees are mostly balanced.
Problem 3
Use this interval structure:(define-struct Interval ([min : Real] [max : Real]))
Write a function plotter according to this type ascription:
The five arguments to this function are as follows:(: plot : (Real -> Real) Interval Interval Real Real -> Image)
- f, any function of type Real -> Real,
- x-extent, the lower and upper bounds of the x axis in the plot,
- y-extent, the lower and upper bounds of the y axis in the plot,
- x-pixel, the unit value of each pixel in the x direction, and
- y-pixel, the unit value of each pixel in the y direction.
As a hint to how to approach this problem, you might draw one one-pixel-wide vertical slice of the plot at a time, and put all the vertical slices together, left to right, with beside. That's the approach I followed. This strategy is reasonably simple to implement (though still challenging to get right) and the results, as you can see below, are good. Furthermore, you can start by using build-list to make a list of the x values, then use map to create a list of images each one pixel wide, then use foldr and beside to combine all those one-pixel-wide images into one big image.
Here is a gallery of sample plots to illustrate the behavior of plot. Please note I have used 'aliceblue as the background color of the plots, and 'blue for the color of the function itself; you need not use these colors.
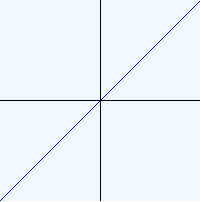
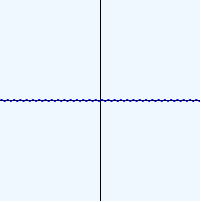
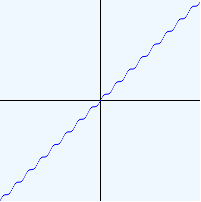
(plot identity (Interval -100 100) (Interval -100 100) 1 1)
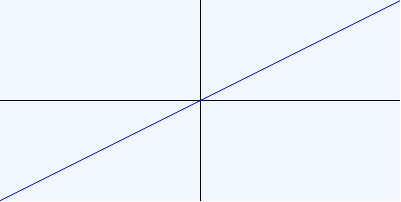
(plot identity (Interval -100 100) (Interval -100 100) 1/2 1)
(plot identity (Interval -100 100) (Interval -100 100) 1 1/2)
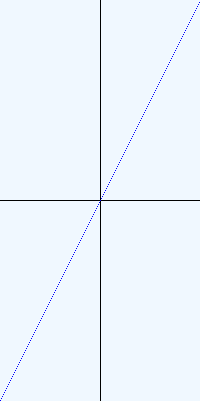
You will notice in this plot a "dotted line" quality -- it is fine for certain plots to look like that. In other words, the plot of the function need not be smoothly connected.
(plot (λ ([x : Real]) (* 1/5 (sqr x)))
      (Interval -50 50) (Interval -100 100) 1/2 1)
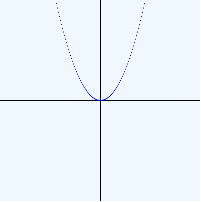
The function should go outside the plot area as needed without perturbing the plot image.
(plot sin (Interval -100 100) (Interval -100 100) 1 1)
(plot sin (Interval -100 100) (Interval -2 2) 1 1)

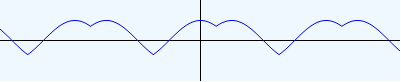
(plot sin (Interval -10 10) (Interval -2 2) 1/16 1/16)
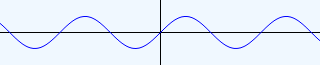
Fiddling with the extents and the scales is the way to make plots look right.
Problem 4
Write the f+, f* and fmax functions.
(: f+ : (Listof (Real -> Real)) -> (Real -> Real))
Return the function whose result is the sum of applying all the functions in the argument list. When the argument to f+ is the empty list, the return value is the constant function that always returns 0.
(plot (f+ (list sin identity)) (Interval -50 50) (Interval -50 50) 1/2 1/2)
(: f* : (Listof (Real -> Real)) -> (Real -> Real))
Return the function whose result is the product of applying all the functions in the argument list. When the argument to f* is the empty list, the return value is the constant function that always returns 1.
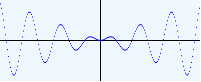
(plot (f* (list sin identity)) (Interval -20 20) (Interval -20 20) 1/5 1/2)
(: fmax : (Listof (Real -> Real)) -> (Real -> Real))
Return the function whose result is the maximum of applying all the functions in the argument list. When the argument to fmax is the empty list, raise an error, since fmax is undefined on the empty list of functions. When the argument is a singleton list of functions, just return that function.
(plot (fmax (list sin cos)) (Interval -10 10) (Interval -2 2) 1/20 1/20)
Practice
The quiz Friday will be mostly about trees, lambda, match, and higher-order functions (map, filter, fold, build-list).
Submit your work in your repository in hw11/hw11.rkt by noon Friday, July 14.