Modeling Language Shifts
Due: Friday, October 21st, 4:30pm CT
The goal of this assignment is to give you practice using nested loops, lists of lists, and functions.
You may work alone or in a pair on this assignment. The algorithms you need to implement for this assignment are more challenging than the first assignment. We recommend starting early.
Getting started
If you are going to work individually, follow the invitation URL provided on Ed Discussion and, when prompted for a team name, simply enter your CNetID.
If you are going to work in a pair, the process involves a couple of extra steps. The process is described in our Coursework Basics page. Please head over to that page, and return here once you’ve created your team repository.
Next, you will need to initialize your repository. If you are working in a pair only one of you should complete these steps. If you repeat these steps more than once, you may break your repository.
First, create a TEAM variable in the terminal that contains either your CNetID
(if you’re working individually) or your team name (if you’re working in a pair):
TEAM=replace_me_with_your_cnetid_or_team_name
(remember you can double-check whether the variable is properly set by
running echo $TEAM)
Finally, run these commands (if you don’t recall what some of these commands do, they are explained at the end of the Git Tutorial):
cd ~/capp30121
mkdir pa2-$TEAM
cd pa2-$TEAM
git init
git remote add origin git@github.com:uchicago-CAPP30121-aut-2022/pa2-$TEAM.git
git remote add upstream git@github.com:uchicago-CAPP30121-aut-2022/pa2-initial-code.git
git pull upstream main
git branch -M main
git push -u origin main
You will find the files you need for the programming assignment directly in the root of your
repository, including a README.txt file that explains what each file is. Make sure you read that file.
If you are working in a pair, the person who did not initialize the repository should setup
the TEAM variable (as shown above) and then clone the repository like this:
cd ~/capp30121
git clone git@github.com:uchicago-CAPP30121-aut-2022/pa2-$TEAM.git
cd pa2-$TEAM
git remote add upstream git@github.com:uchicago-CAPP30121-aut-2022/pa2-initial-code.git
If you are working in a pair, you should also take a moment to read the working_pair section of the Coursework Basics page.
Introduction
Many regions around the world support populations that speak more than one language. For example, both Spanish and Catalan are spoken in the Valencia region of Spain (strictly speaking, the language spoken in Valencia is a form of Catalan known as Valencian). Catalan is more notably spoken in the Catalonia region, but we will be focusing on the use of Catalan in the Valencia region. More precisely, some of the population of Valencia is monolingual (only speaks Spanish) and the rest are bilingual (speak Spanish and Catalan). Elsewhere along the Mediterranean coast, populations are French/French-and-Catalan and Italian/Italian-and-Catalan speakers.
When there are two languages spoken by a population, a hierarchy is often established. One language becomes the dominant language (DL) and is spoken by everyone in the population. The other is the subordinate language (SL), which is spoken by only some of the population. In Valencia, Spanish is the dominant language and Catalan is the subordinate language.
It is possible for both languages to survive side-by-side, but often the SL dies out in favor of the DL. The process of speakers abandoning the SL to speak the DL is called a language shift, which is complete when there are no living speakers of the SL.
Language preferences are transmitted from parents to their children. Parents decide which language habits to pass to their children by considering their engagement with language. For example, if a SL speaker is highly engaged with the SL (perhaps there are many opportunities to speak the SL in their community), they will speak to their children in the SL and the SL will be passed to a new generation. On the other hand, if an SL speaker is weakly engaged with the SL, they might abandon the SL and speak to their children in the DL.
Your task in this assignment is to implement a variation of the language shift model described by Beltran, et al. in their paper A Language Shift Simulation Based on Cellular Automata. You will start with a region of DL and SL speakers and simulate how language preferences change over time. You will especially consider the conditions that facilitate language shifts. Please note that you do not need to read the Beltran paper to do this programming assignment.
Before you start your implementation, we will specify the details of the components of the abstract model you will be using, and then describe the concrete data structures you will be using to implement the model.
Our model
For the model, we need to specify the:
a region,
the speakers in a region,
a speaker’s neighborhood,
community centers in a region,
a speaker’s engagement level,
language transmission rules,
a step in the simulation, and
the stopping conditions for the simulation.
Regions
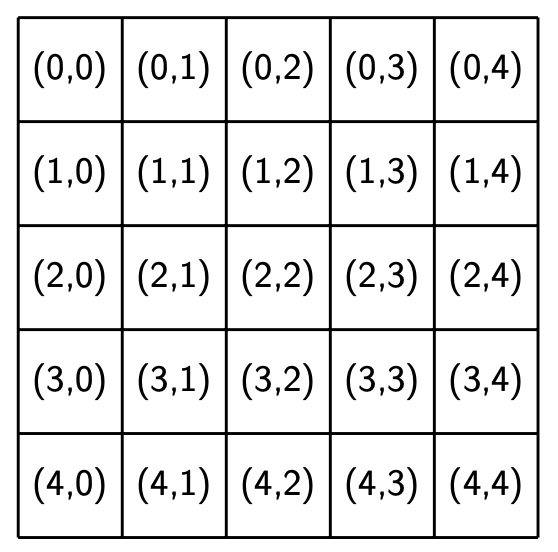
A region is modeled as a N by N grid, where the value of N can be different for different regions. Each grid location (sometimes called a cell) represents a home in the region that houses speakers with a language preference.
Here is a sample region with N = 5. This figure shows the location of each home (cell) in the region.
Sample region |
|---|
Speakers
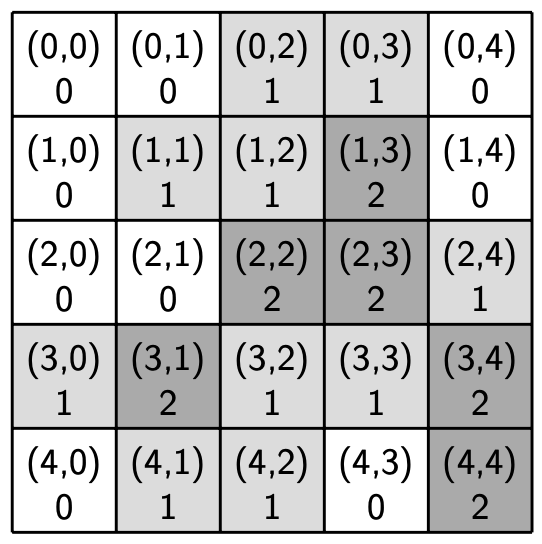
Each cell in the grid is home to some speakers that have a language preference. Language preference is one of three different states and indicates the level of engagement with the SL:
State 0: Speakers are monolingual and do not speak the SL.
State 1: Speakers are bilingual (they speak both the SL and the DL), but only speak the SL in certain situations.
State 2: Speakers are bilingual and prefer to speak the SL whenever possible.
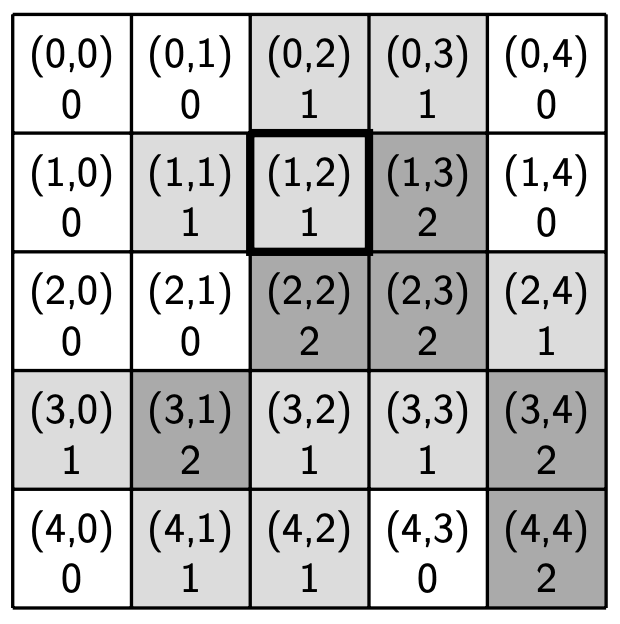
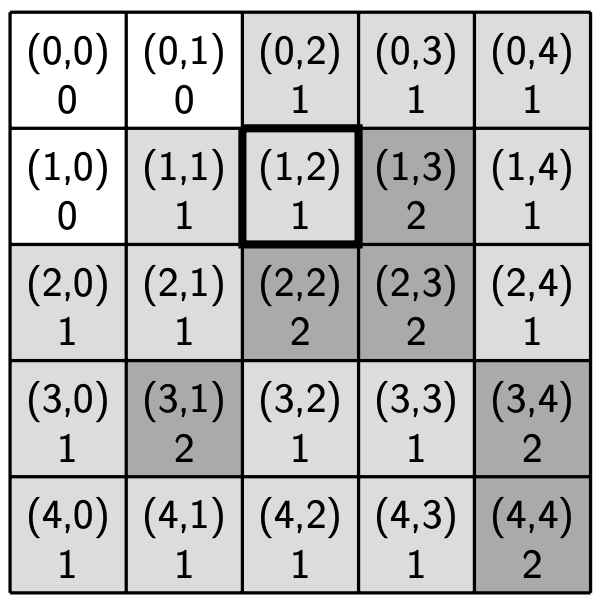
Here is a sample region with speakers that we will use throughout this write-up. A white cell indicates that a home is occupied by speakers in language state 0, a light grey cell indicates that a home is occupied by speakers in language state 1, and a dark grey cell indicates that a home is occupied by speakers in language state 2.
Sample region with speakers |
|---|
Neighborhood
The neighborhood of a home will be defined by a parameter R. The R-neighborhood of a home at location (i, j) in an N by N region contains all locations (k, l) such that:
0 <= k < N
0 <= l < N
|k - i| <= R
|l - j| <= R
This is often called a Moore neighborhood. A neighborhood with parameter R = x is called an “R-x neighborhood”.
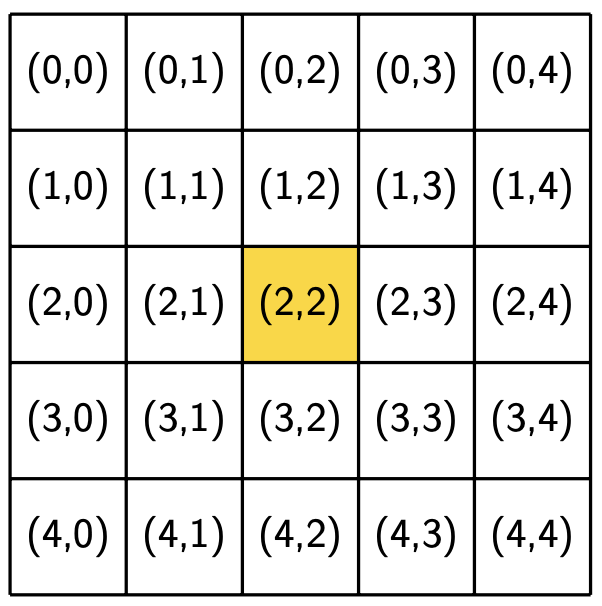
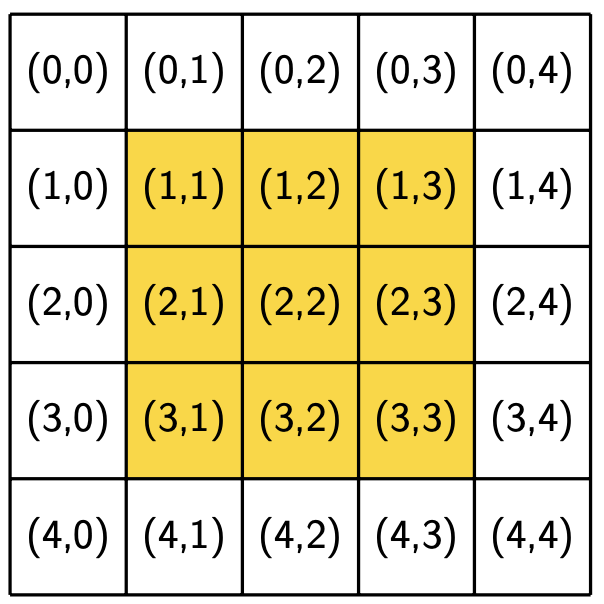
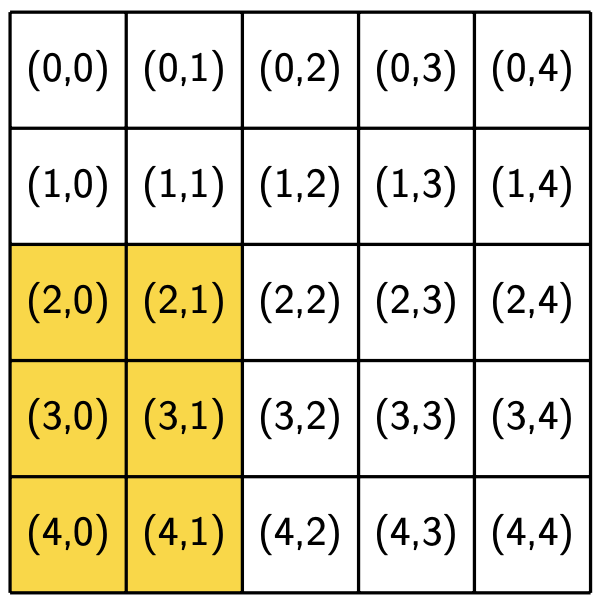
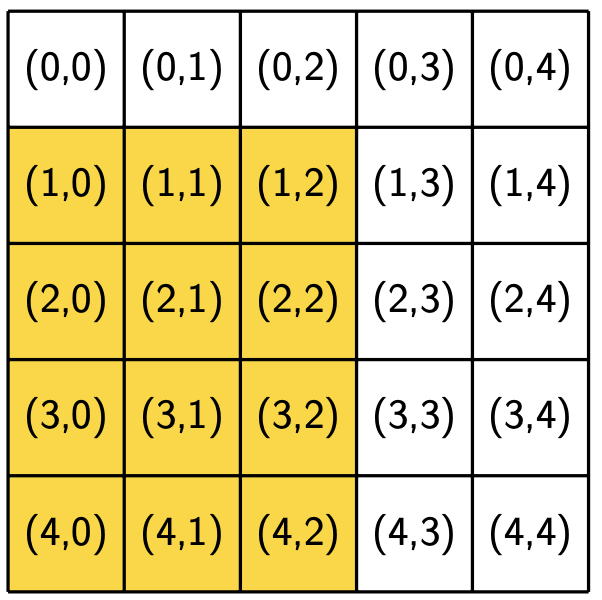
The following figures show the neighborhoods around locations (2, 2) and (3, 0) for different values of R. We use yellow to indicate that a location is included in the specified neighborhood and white to indicate that a location is not included in the neighborhood.
Neighborhood around (2, 2) |
Neighborhood around (3, 0) |
||
|---|---|---|---|
R = 0 |
R = 1 |
R = 1 |
R = 2 |
Notice that location (3, 0), which is closer to the boundaries of the region, has fewer neighbors for the same value of R than location (2, 2), which is the middle of the region. Also notice that location (i, j) is considered part of its own neighborhood.
Community centers
Each region also contains some number of community centers. Community centers offer SL-speaking homes within a service distance D opportunities to engage with the SL. A community center at location (i, j) with service distance D provides services for SL-speaking homes in the R-D neighborhood around (i, j). That is, a community center services homes within its Moore neighborhood with parameter R = D. Community centers do not serve DL-speaking homes.
Sample region with a community center |
|---|
Community center location: (1, 2)
Community center service distance: 1
|
For example, say our sample region has a community center at location (1, 2) with service distance 1. The community center is shown above with a bold outline and its R-1 neighborhood is shaded in yellow. The SL-speaking homes at locations (0, 2), (0, 3), (1, 1), (1, 2), (1, 3), (2, 2) and (2, 3) are within the service distance of the community center, while those farther away are not. Again, community centers do not service DL-speaking homes.
Notice that homes and community centers can overlap. In this example, there is a home at location (1, 2) with speakers in language state 1 and a community center at location (1, 2). You can think of this as there being an apartment above a store.
Although our sample region has just one, a region can have any number of community centers.
Engagement level
We define an engagement level for a home at a specified location to be E = S/T.
S is the sum of the language preferences (states 0, 1, or 2) of the homes in the neighborhood centered at that location and T is the total number of homes in the neighborhood.
You can think of this number as the opportunity for speakers to engage in the SL.
A home’s engagement level will always be a number between 0 and 2, inclusive. If the engagement level of a home is 0, everyone in their neighborhood (including themselves) has language state 0. Similarly, if the engagement level of a home is 2, everyone in their neighborhood has language state 2.
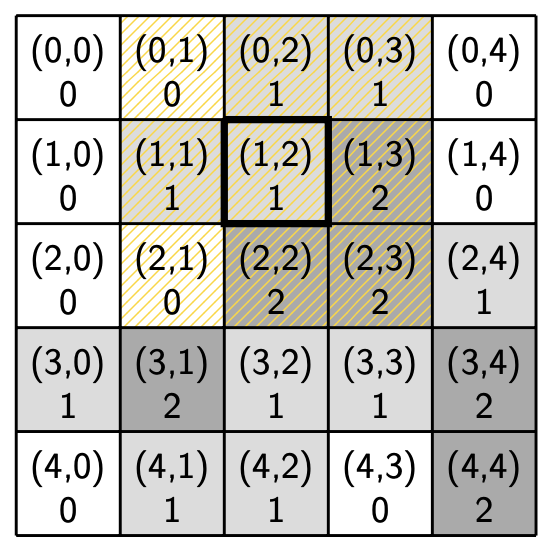
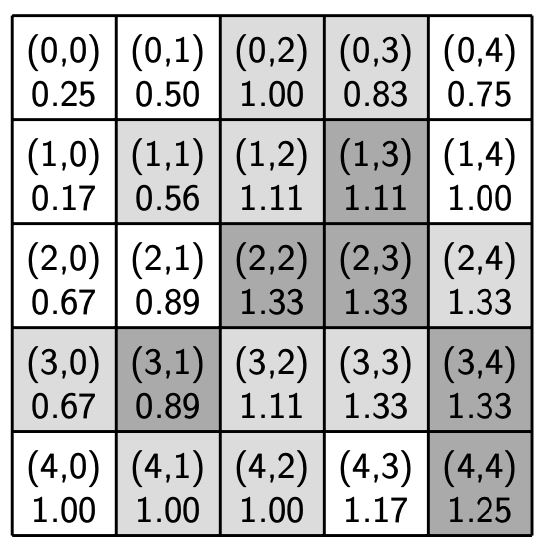
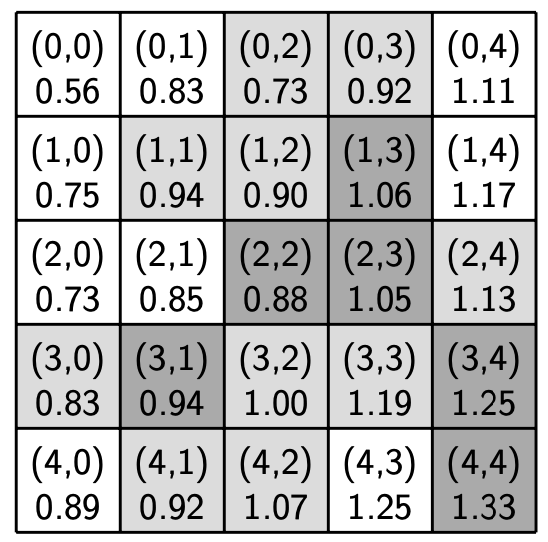
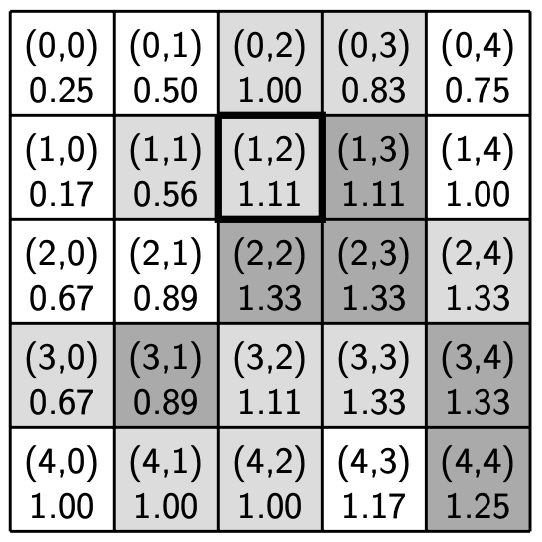
The figures below show the engagement level for each home in the sample region from before with R-1 neighborhoods (left) and R-2 neighborhoods (right). The engagement level is shown beneath the location in each cell.
Engagement levels |
|
|---|---|
Parameters:
R: 1
|
|
Sample region
|
Engagement levels
|
Parameters:
R: 2
|
|
|---|---|
Sample region
|
Engagement levels
|
Hint: Think carefully about how you will compute the engagement level of a home.
You do not need to use an additional data structure (e.g., you don’t need construct a list of locations in the neighborhood of a home to compute its engagement level).
You do not need to check every location in the region. For example, to calculate the engagement level of the home at location (2, 2) with R = 1, there is no need to visit location (0, 0).
Transmission rules
You will use the following rules to determine the language preferences of the next generation.
Parents pass their language preferences to their children according to their engagement level E and the following table:
Parent’s state: |
Child’s state: |
||
|---|---|---|---|
0 |
1 |
2 |
|
0 |
E <= B |
B < E |
|
1 |
E < B |
B <= E <= C |
C < E |
2 |
E <= A |
A < E < B |
B <= E |
The values of A, B, C, which are thresholds that represent the engagement level needed to transition from one language state to another, are parameters of the simulation. Notice that it is not possible to transition from state 0 to state 2 in a single generation.
Furthermore, if an SL-speaking home (a home with speakers in state 1 or state 2) is within the service distance of a community center, children cannot inherit a lower language preference than their parents. You can think of the community center as providing enough engagement with the SL for a parent to pass down at least their own preference state regardless of how unengaged their neighbors may be.
Let’s apply the transmission rules to our sample region with an R-1 neighborhood. First, we will apply the transmission rules to locations in a region without any community centers.
Transmission example in a region without community centers |
|
|---|---|
Parameters:
R: 1
Transition thresholds (A, B, C): (0.6, 0.8, 1.6)
|
|
Sample region
|
Engagement levels
|
Example 1: (0, 0): The speakers at location (0, 0) are currently in language state 0. Based on the current values of the neighbors of (0, 0) (shown in the image above), the speakers have a 0.25 engagement level in an R-1 neighborhood. Using the transmission table, the next language state of (0, 0) will be 0, since 0.25 <= B = 0.8.
Example 2: (1, 1): The speakers at location (1, 1) are currently in language state 1. Based on the current values of the neighbors of (1, 1) (again, shown in the image above), the speakers have an approximately 0.56 engagement level. Using the transmission table, the next language state of (1, 1) will be 0, since 0.56 < B = 0.8. This is an example of an SL-speaking home shifting to the DL.
Example 3: (1, 4): The speakers at location (1, 4) are currently in language state 0. Based on the current values of the neighbors of (1, 4), the speakers have a 1.0 engagement level. Using the transmission table, the next language state of (1, 4) will be 1, since B = 0.8 < 1.0. This is an example of a DL-speaking home picking up the SL.
Now let’s apply the transmission rules in a region with a community center at location (1, 2) with service distance 1. A bold outline denotes the location of the community center.
Transmission example in a region with a community center |
|
|---|---|
Parameters:
R: 1
Transition thresholds (A, B, C): (0.6, 0.8, 1.6)
Community center location: (1, 2)
Community center service distance: 1
|
|
Sample region
|
Engagement levels
|
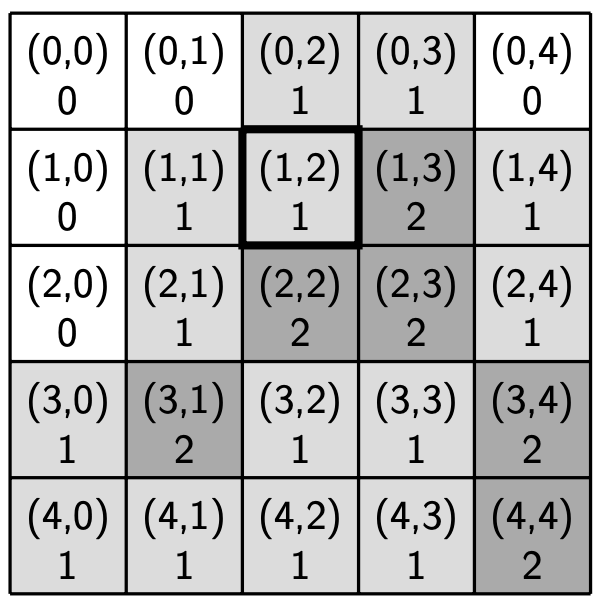
Example 4: (0, 0): The speakers at location (0, 0) are currently in language state 0. Based on the current values of the neighbors of (0, 0) (shown in the image above), the speakers have a 0.25 engagement level in an R-1 neighborhood. Using the transmission table, the next language state of (0, 0) will be 0, since 0.25 <= B = 0.8. Notice that this example is the same as Example 1.
Example 5: (1, 1): The speakers at location (1, 1) are currently in language state 1. Based on the current values of the neighbors of (1, 1), the speakers have an approximately 0.56 engagement level. Using the transmission table, the next language state of (1, 1) should be 0, since 0.56 < B = 0.8. However, location (1, 1) is within the service distance of the community center at location (1, 2). Thus, the next language state of (1, 1) stays at 1.
Example 6: (3, 0): The speakers at location (3, 0) are currently in language state 1. Based on the current values of the neighbors of (3, 0), the speakers have an approximately 0.67 engagement level. Using the transmission table, the next language state of of (3, 0) will be 0, since 0.67 < B = 0.8. Notice that in this case, the location (3, 0) is not within the service distance of the community center at (1, 2).
If the language state of an SL-speaking home were to decrease according to the transmission table, we check to see if they are close to a community center. If they are, their language state cannot go down. It’s not necessary to check whether an SL-speaking home whose language state will increase or stay the same is close to a community center. It’s also never necessary to determine whether or not a home in language state 0 is close to a community center, since community centers only serve SL-speaking homes.
Think carefully about how you will check whether a home is close to a community center. There is no need to visit all of the locations in the neighborhood of a community center in order to determine whether a home is within its service distance.
In the real-world, it’s common to build large programs in stages. Programmers start by implementing simplified versions of their projects, then incrementally add more complex features. We recommend using this strategy here. Start by writing an initial implementation that computes the next language state for a home in a region without any community centers. Then, once you’re sure that works, add support for community centers.
Simulation step
A step in the simulation consists of finding the language preference for the next generation of all homes in a region. You will do this by going once over the grid and updating each home to reflect the language preference of the next generation of speakers using the transmission rules described above.
More precisely, each step starts in the upper-left corner of the region (location (0, 0)) and moves through the region row by row until it reaches the lower-right corner (location (4, 4) in our sample city). The homes in a row will be visited one by one from left to right and the transmission rules are applied to a home at the time of the visit.
The figure below shows our sample region at the start of the step and the end of the step. A bold outline denotes the location of the community center.
Sample simulation step |
|
|---|---|
Parameters:
R: 1
Transition thresholds (A, B, C): (0.6, 0.8, 1.6)
Community center location: (1, 2)
Community center service distance: 1
|
|
Stopping conditions
We will simulate steps until we have
executed a specified maximum number of steps or
executed a step in which no homes have transitioned to a new language state.
Sample simulation |
|
|---|---|
Parameters:
R: 1
Transition thresholds (A, B, C): (0.6, 0.8, 1.6)
Community center location: (1, 2)
Community center service distance: 1
Maximum number of steps: 5
|
|
Data representation
In addition to having an abstract model of a region, we need to have concrete representations for speaker preferences, regions, locations, and community centers.
Representing speakers and language preferences
A home in a region will be represented by an integer indicating that home’s language preference. Language preference is one of three states (state 0, state 1, and state 2) described above. Thus, we will use an integer value 0, 1, or 2 to represent a home of speakers and their language preference.
Representing regions
We will represent a region using a list, where each element of the list is itself a list of integers, each representing a home. You may assume that these integers will always be one of 0, 1, or 2. We will refer to this data structure as the grid.
Here is the list representation of our sample region:
[[0, 0, 1, 1, 0],
 [0, 1, 1, 2, 0],
 [0, 0, 2, 2, 1],
 [1, 2, 1, 1, 2],
 [0, 1, 1, 0, 2]]
Representing locations
We will use tuples of two integers to represent locations. For example, the tuple (2, 4) represents the cell in row 2, column 4 of the grid.
Representing community centers
A community center will be represented by a tuple of two values.
The first value is the location of the community center (which is itself a tuple) and the second is the service distance of the community center.
For example, our community center at location (1, 2) with service distance 1 is represented by the tuple ((1, 2), 1).
All of the community centers in a region will be stored in a list.
For example, if a region has two community centers, one at (1, 2) with service distance 1 and the other at (4, 3) with service distance 2,
this will be represented by the list [((1, 2), 1), ((4, 3), 2)].
If a region has no community centers, this is the empty list.
Task 1
Your goal in this task is to implement the function:
def run_simulation(grid, R, thresholds, centers, max_steps)
in the file language.py.
This function executes the simulation described above on the specified region grid until one of the stopping conditions has been met.
This function must return a tuple consisting of two items: a tuple of three integers representing the total number of homes in each language state at the end of the simulation, and the number of steps taken in the simulation.
Furthermore, your function should modify the grid argument.
By changing the grid in-place, the grid at the end of the simulation will reflect the language preference changes that took place during the simulation.
You should think carefully about how to split this task into multiple functions. That is, you should write a series of auxiliary functions, each of which implements a subtask. When designing your function decomposition, keep in mind that you need to accomplish the following subtasks:
determine whether an SL-speaking home is within the service distance of a community center,
determine the engagement level of a home,
determine the language state of the next generation of speakers in a home according to the transmission rules,
simulate a step of the simulation, and
run the steps until one of the stopping conditions is met.
Do not combine the last two or three tasks into one mega-task. The resulting code would be hard to read and debug. Combining too many subtasks into a single function will have an impact on your code quality score. Don’t forget to include function headers comments (i.e., docstrings) in your helper functions!
Task 2
Beltran, et al. report that language shifts, when the occur, usually happen quickly (e.g., in only a few generations). In this task, you will complete the function:
def median_language_shift_length(grid, R, threshold_list, centers, max_steps)
in the file language.py, which takes a list of tuples for the thresholds A, B, and C.
This function will run your simulation once for each of the tuples in the list threshold_list.
It should return the median number of steps taken over all the simulations.
That is, you will need to collect the number of steps taken in each run of the simulation, and compute the median.
Recall that the median is the middle value in a sorted list. If the list contains an even number of values,
you can use the greater of the two middle values.
For example, if the list contains 6 values, sort the list and use the value at index 3 (remember that list indexing starts at zero).
You may use built-in Python functions to help with the sorting in this task.
You should start with the same grid for each simulation, but remember that your run_simulation function modifies the grid.
It might be helpful to review the “Shallow copy versus deep copy” section of the “Lists, Tuples, and Strings” chapter of your textbook
before beginning this part.
You are welcome to make use of the the copy module in this task.
Running your program
We strongly encourage you to run your functions as you write them! The surest way to guarantee that you will need to spend hours debugging is to write all your code and only then start testing.
You can find sample regions to play with in the tests subdirectory of your pa2 directory. For example, the
file tests/writeup-grid-with-cc.txt contains the sample region used throughout this writeup.
The file tests/writeup-grid.txt contains the same region without the community center.
Please see tests/README.txt for descriptions of each of the sample regions.
We have also provided a library called utilities.py that you might find useful when
you’re trying out your code. It contains the following functions for working with regions:
read_grid, which takes a string that is the name of a file containing a region and returns the corresponding region as a list of lists and a list of community centers in that region, as a tuple.print_grid, which takes a region as a list of lists and prints the region, including N (the size of the region).
As you’re working on this assignment, we recommend trying out your functions in IPython. You might start to experiment like this:
In [1]: %load_ext autoreload

In [2]: %autoreload 2

In [3]: import language, utility

In [4]: region, centers = utility.read_grid("tests/writeup-grid-with-cc.txt")

In [5]: utility.print_grid(region)
N: 5
[0, 0, 1, 1, 0]
[0, 1, 1, 2, 0]
[0, 0, 2, 2, 1]
[1, 2, 1, 1, 2]
[0, 1, 1, 0, 2]
The session above:
sets IPython to automatically reload your code,
imports the modules (files that contain code) you’re working with (notice that you don’t need to include the
.pyextension),reads a sample grid, and stores the region in a variable called
regionand a list of community centers in a variable calledcenters,and prints out the sample region.
From here, you can go on to test the region with some of your own functions.
Running run_simulation
We have included code in language.py that calls your run_simulation function
and, if the region is small enough, prints the results.
Running language.py with the --help flag shows the flags to use for different arguments:
$ python3 language.py --help
Usage: language.py [OPTIONS]

Run the simulation.

Options:
--grid_file PATH     filename of the grid
--r INTEGER          neighborhood radius
--a FLOAT            transition threshold A
--b FLOAT            transition threshold B
--c FLOAT            transition threshold C
--max_steps INTEGER  maximum number of simulation steps
--help               Show this message and exit.
Here is a sample use of this program:
$ python3 language.py --grid_file tests/writeup-grid-with-cc.txt --max_steps 5
and here is the output it should print:
Running the simulation...
Initial region:
    [0, 0, 1, 1, 0]
    [0, 1, 1, 2, 0]
    [0, 0, 2, 2, 1]
    [1, 2, 1, 1, 2]
    [0, 1, 1, 0, 2]
With community centers:
    ((1, 2), 1)
Final region:
    [0, 0, 1, 1, 1]
    [0, 1, 1, 2, 1]
    [1, 1, 2, 2, 1]
    [1, 2, 1, 1, 2]
    [1, 1, 1, 1, 2]
Final language state frequencies: (3, 16, 6)
Number of steps in simulation: 3
You can also specify the neighborhood radius R and any of the transition thresholds A, B, and C. For example:
$ python3 language.py --grid_file tests/writeup-grid-with-cc.txt --r 2 --b 1.2
will print:
Running the simulation...
Initial region:
    [0, 0, 1, 1, 0]
    [0, 1, 1, 2, 0]
    [0, 0, 2, 2, 1]
    [1, 2, 1, 1, 2]
    [0, 1, 1, 0, 2]
With community centers:
    ((1, 2), 1)
Final region:
    [0, 0, 1, 1, 0]
    [0, 1, 1, 2, 0]
    [0, 0, 2, 2, 0]
    [0, 1, 0, 0, 1]
    [0, 0, 0, 0, 1]
Final language state frequencies: (15, 7, 3)
Number of steps in simulation: 1
Running median_language_shift_length
You can run your median_language_shift_length function by hand in IPython.
In [3]: import language, utility

In [4]: region, centers = utility.read_grid("tests/writeup-grid-with-cc.txt")

In [5]: threshold_list = [(0.6, 0.6, 1.6), (0.6, 0.8, 1.6), (0.6, 1.0, 1.6), (0.6, 1.2, 1.6), (0.6, 1.4, 1.6)]

In [6]: language.median_language_shift_length(region, 1, threshold_list, centers, 20)
Out[6]: 3
Notice that we we find the same results that Beltran, et al. report. Note that we used a large value for
max_steps to prevent the simulation from ending before all possible transitions were made.
Automated testing
In the “Running your program” section above, we described how to use IPython to test out
your functions as you write them, as well as how to run your run_simulation function from the command line.
We have also provided test code for your run_simulation and median_language_shift_length functions.
We will be using py.test to test your code.
You can run our run_simulation test from a Linux terminal window with the command:
$ py.test -vx test_run_simulation.py
When a test fails, the output will include instructions on how to run the test in IPython.
We have also provided test code for median_language_shift_length. You can run these tests from the command line with:
$ py.test -vx test_median_language_shift_length.py
You can find detailed information about running automated tests with py.test in the Testing Your Code page.
Grading
The assignment will be graded according to the Rubric for Programming Assignments. Make sure to read that page carefully; the remainder of this section explains aspects of the grading that are specific to this assignment.
In particular, your completeness score will be determined solely on the basis of the automated tests, which provide a measure of how many of the tasks you have completed:
Grade |
Percent tests passed |
|---|---|
Exemplary |
at least 95% |
Satisfactory |
at least 80% |
Needs Improvement |
at least 50% |
Ungradable |
less than 50% |
For example, if your implementation passes 85% of the tests, you will earn an S (satisfactory) score for completeness.
The code quality score will be based on the general criteria in the Rubric for Programming Assignments but, in this programming assignment, we will also be paying special attention to the following:
Not using decomposition: Is your
run_simulationfunction doing the bulk of the work in Task 1? You need to decompose the problem into small tasks and implement those tasks in helper functions. You will receive an U if you implement your entire solution inside therun_simulationfunction.Repeating code instead of using existing functions: You should never copy-paste the code from one helper function to another if you need to repeat a task. Think about how you can use the existing functions in your code.
Unnecessarily iterating through the entire grid: Are you iterating through the entire grid to calculate a home’s engagement level? Remember, the engagement level of a home depends only on its neighbors.
Constructing unnecessary lists: Are you constructing a list that is not actually needed to perform a certain computation? For example, are you creating lists of neighbors somewhere in your code? You do not need to use an additional data structure to compute the engagement level of a home, nor to check whether a home is within the service distance of a community center.
Doing unnecessary computation: Are you doing unnecessary computation, like checking whether a DL-speaking home is close to a community center? Similarly, are you checking whether an SL-speaking home is close to a community center when you don’t need to?
Keeping track of unnecessary information: When running a simulation, you will be progressing through the state of the region over a series of steps. We really only care about the final state of the region (the region at the end of the simulation). If you find yourself producing a list of regions (one for each iteration of the simulation), you should ask yourself whether you actually need to keep track of that information.
The use of unnecessary loops: Are you looping through the grid multiple times when a single pass through it is enough? Careful with using the
countmethod! That uses aforloop internally, so each call to that method on a list counts as a full pass through the list.Using
whileloops when aforloop would be more appropriate: When iterating over a list or a defined range of values, you should always use aforloop.
While these are the main things we care about in this assignment, please remember that it is not possible for us to give you an exhaustive list of every single thing that could affect your code quality score (and that thinking in those terms is generally counterproductive to learning how to program; see our How to Learn in this Class page for more details).
In general, avoiding all of the above issues will increase the likelihood of getting an E; if your code has a few (but not most) of the above issues, that will likely result in an S; if your code suffers from most of those issues, it will likely get an N. That said, to reiterate, we could also find other issues in your code that we did not anticipate, but that end up affecting your code quality score. When that happens, we encourage you to see these as opportunities to improve your code in future assignments (or as specific things to change if you decide to resubmit the assignment).
And don’t forget that style also matters! You could avoid all of the above issues, and still not get an E because of style issues in your code. Make sure to review the general guidelines in the Rubric for Programming Assignments, as well as our Style Guide.
Cleaning up
Before you submit your final solution, you should, remove
any
printstatements that you added for debugging purposes andall in-line comments of the form: “YOUR CODE HERE” and “REPLACE …”
Also, check your code against the style guide. Did you use good variable and function names? Do you have any lines that are too long? Did you remember to include a header comment for all of your functions?
Do not remove header comments, that is, the triple-quote strings that describe the purpose, inputs, and return values of each function.
As you clean up, you should periodically save your file and run your code through the tests to make sure that you have not broken it in the process.
Submission
You will be submitting your work through Gradescope (linked from our Canvas site). The process will be the same as with previous coursework: Gradescope will fetch your files directly from your PA2 repository on GitHub, so it is important that you remember to commit and push your work! You should also get into the habit of making partial submissions as you make progress on the assignment; remember that you’re allowed to make as many submissions as you want before the deadline.
If you are working in a pair, only one of you has to make a submission
To submit your work, go to the “Gradescope” section on our Canvas site. Then, click on “Programming Assignment #2”. If you completed previous assignments, Gradescope should already be connected to your GitHub account. If it isn’t, you will see a “Connect to GitHub” button. Pressing that button will take you to a GitHub page asking you to confirm that you want to authorize Gradescope to access your GitHub repositories. Just click on the green “Authorize gradescope” button.
Then, under “Repository”, make sure to select your uchicago-CAPP30121-aut-2022/pa2-$TEAM.git repository.
Under “Branch”, just select “main”.
Finally, click on “Upload”. An autograder will run, and will report back a score. Please note that this autograder runs the exact same tests (and the exact same grading script) described in Testing Your Code. If there is a discrepancy between the tests when you run them on your computer, and when you submit your code to Gradescope, please let us know.
If you are working in a pair, Gradescope will initially create an individual submission. You will need to explicitly add your partner to your submission, so that your work is associated with them too.
Acknowledgments
This assignment was inspired by the work A Language Shift Simulation Based on Cellular Automata by Beltran, et al. You can find the full work here.
