Lab 6: Quantitative Data Analysis
Learning Goals
- Students will learn which statistical tests to run (given the nature of the data) on HRI data.
- Students will gain experience conducting quantitative data analysis of HRI data using JASP and on real HRI data.
To Complete Before Lab (or at the Beginning of Lab)
Download and Install JASP
For the lab today, we will be using JASP to conduct our quantitative data analysis. JASP is a free and open-source software program for statistical analysis. Follow this link to download JASP and follow the installation instructions.
Working in Groups
Like in Lab 3, you will work at a table with 3-4 other students. Each individual within the group is expected to conduct their own data analysis and submit their individual work. While the submission for this lab is individual, we highly encourage your groups to collaborate with one another by sharing ideas and helping each other debug.
Lab 6 Deliverables & Submission
Your work on Lab 6 will involve:
- Running statistical tests on the HRI data you can find in this Google Drive folder and
- Reporting the results of your tests by filling out this Lab 6 HRI Quantitative Data Analysis Worksheet. Please open the Google Doc worksheet, copy its contents, and start a new Google or word document where you can contribute to it.
To receive credit for this lab, you will need to submit your completed quantitative data analysis worksheet to Canvas by Friday, May 2 at 6:00pm.
Lab 6 HRI Study, Data, and Your Goal for this Lab
During this lab, you'll be analyzing the data from an HRI study that my lab has recently conducted. This study is currently under review, so please do not share the details of this study with anyone outside of our class. Read an overview of the study at this link, so you can understand the study hypotheses, methods, and measures.
To access the two data files for Lab 6, go to this Google Drive folder and download the two csv files: lab_06_decision_making_data.csv and lab_06_survey_data.csv.
Your goal for this lab is run a quantitative analysis on the measures we collected for this HRI study and report the results. The outcome of this lab will be a written report with graph figures that resembles the "Results" sections of the papers we've read in class.
What Statistical Test Should I Run? - Selecting the Appropriate Statistical Test
For each of the measures in the HRI study, you will need to determine which statistical test is appropriate to run on the data. The following is a guide I (Sarah) have written to help determine which statistical test to run.
The first step to take when choosing which statistics test to run on your data to answer a specific research question is first identifying the following variables:
- Independent Variable(s) - any variables that the researchers directly manipulate can be considered independent variables
- Dependent Variable - the dependent variable is the variable that is being studied and is also called the outcome variable
- Covariate(s) - covariates (or control variables) are a subclass of independent variables, these variables are not the primary variables manipulated by researchers, but may still have an influence on the dependent variables; common covariates I use are demographics such as the age and gender of participants and any factors I think may influence participants' responses (e.g., extraversion for studies where I'm measuring conversation dynamics)
Next, we must consider whether the independent and dependent variables we're investigating are categorical or continuous.
- Categorical variables can be sorted into categories and do not hold any numeric value, even if they are represented by a number. Here are some examples of categorical variables: gender, the presence of robot emotion (present or absent), whether or not the participant chose to collaborate with the robot.
- Continuous variables hold numeric values that vary along some numeric range. Continuous variables can be responses to Likert questionnaire ratings (e.g., psychological safety and inclusion ratings), a count of behavior occurrences (e.g., the number of words a participant spoke), or a numeric observation (e.g., a participant's age).
Now that we have a handle on the types of variables we're dealing with and whether those variables are categorical or continuous, we can now determine what kind of statistical test to run to answer our research question. By answering the following questions you can determine which test you should run:
-
Are the independent variable(s) categorical?
-
Is the dependent variable categorical?
-
Are there no covariates and only one independent variable? → Run a Chi Square test
- JASP: Frequencies > Classical > Contingency Tables
-
Are there any covariates or multiple independent variables? → Run a logistic regression
- JASP: Regression > Classical > Logistic Regression
-
Are there no covariates and only one independent variable? → Run a Chi Square test
-
Is the dependent variable continuous?
-
Are there no covariates? → Run a t-test or a 1-way ANOVA
- JASP T-Test: T-Tests > Classical > Independent Samples T-Test
- JASP 1-way ANOVA: ANOVA > Classical > ANOVA
-
Are there any covariates? → Run a 1-way ANCOVA
- JASP: ANOVA > Classical > ANCOVA
-
Are there no covariates? → Run a t-test or a 1-way ANOVA
-
Is the dependent variable categorical?
-
Are the independent variable(s) continuous?
-
Is the dependent variable categorical?
-
Are there no covariates? → Run a Pearson correlation or a logistic regression
- JASP Pearson Correlation: Regression > Classical > Correlation
- JASP Logistic Regression: Regression > Classical > Logistic Regression
-
Are there any covariates? → Run a logistic regression
- JASP: Regression > Classical > Logistic Regression
-
Are there no covariates? → Run a Pearson correlation or a logistic regression
-
Is the dependent variable continuous?
-
Are there no covariates? → Run a Pearson correlation
- JASP: Regression > Classical > Correlation
-
Are there any covariates? → Run a linear regression
- JASP: Regression > Classical > Linear Regression
-
Are there no covariates? → Run a Pearson correlation
-
Is the dependent variable categorical?
Using JASP
Loading Data into JASP
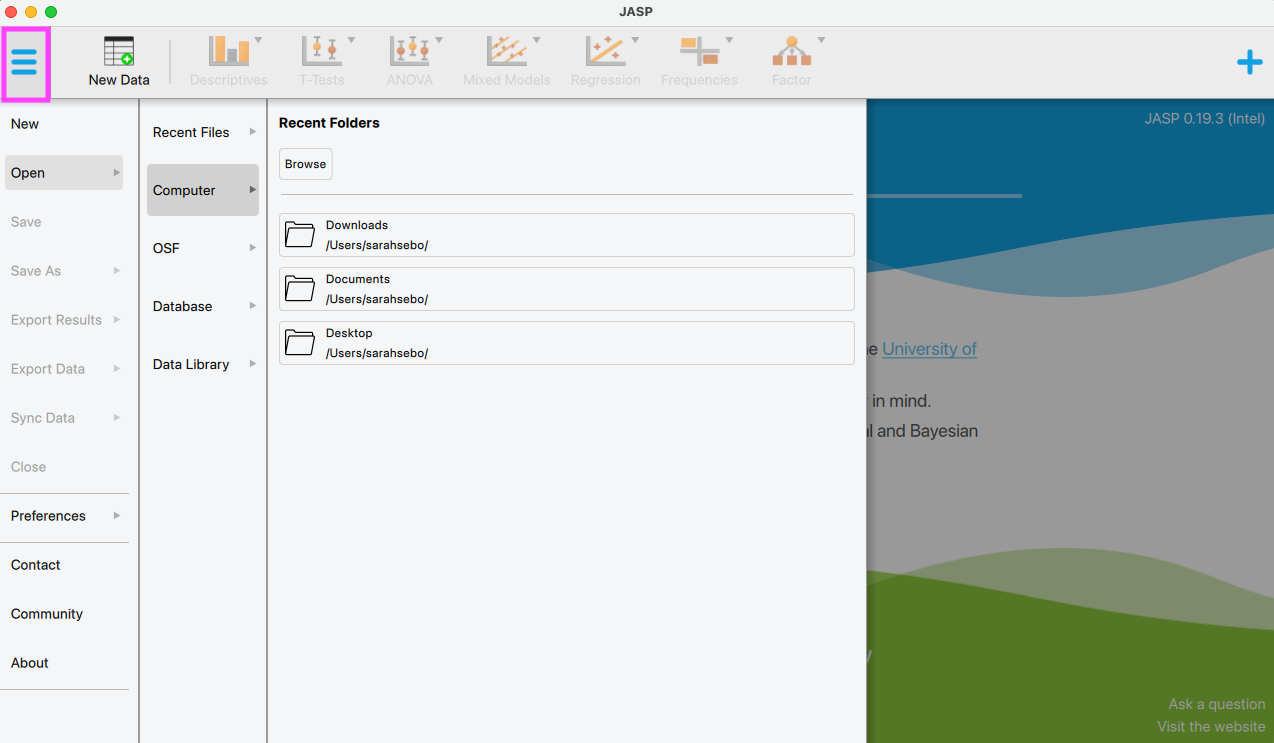
To load the data into JASP, select the button with the three horizontal lines in the top left corner of the JASP window (see image below). Then select Open then Computer and navigate to the folder where you saved the two csv files. Select one of the files and click Open. JASP should nwo show you a table with all of the data in it.
Running a Statistical Test in JASP (e.g., an ANOVA)
In this section, we will walk through how to run a statistical test in JASP. For this example, we will run a 1-way ANOVA on the lab_06_survey_data.csv file for the you_other dependent variable. Here are the steps we followed to run this analysis:
- Main Options:
- Choose the test: Select the ANOVA test by selecting: ANOVA > Classical > ANOVA
- Select dependent variable: Choose the dependent variable of interest from the list on the left (
you_other) and click the arrow button next to "Dependent Variable" to add it. -
Select fixed factors: Choose the independent variable(s) of interest from the list on the left (
Feedback Valence (Positive or Negative)andTreatment (Equal or Unequal)) and click the arrow button next to "Fixed Factors" to add it (see below).

- Descriptive Statistics: Under "Display" select the box for "Descriptive Statistics". This will provide you with the number of participants in each condition, means, and standard deviations of your dependent variable for each condition.
- Effect Size: Under "Display" select the box for "Estimates of Effect Size" and then select partial eta squared (η2). This will add the effect size η2 to the ANOVA table.
- Look for Significant Results: Examine your ANOVA table and look for p-values less than 0.05. If you see any, you have a statistically significant result!
- Post Hoc Tests:
- Are Post Hoc Tests Necessary?
- Post hoc tests are used when there is a significant finding in the main ANOVA and more work needs to be done to determine which experimental conditions exactly are different from one another.
- When post hoc tests aren't necessary: If you have a significant main effect (i.e., one of your fixed factors has a significant effect) where that fixed factor only has two levels, you DO NOT NEED to run post-hoc tests. The ANOVA is sufficient to declare that one condition is significantly different than another.
- When post hoc tests are necessary: If you have a significant interaction effect (i.e., the combination of two or more of your fixed factors has a significant effect) or you have a significant main effect where the factor has more than two levels, you need to do further analysis to determine which of the experimental conditions (or combinations) are significantly different than the others. Here, you will find post-hoc tests necessary and helpful.
- Running Post Hoc Tests:
- Select factors for post-hoc tests: Select the variable(s) representing the significant effect(s) you found in your original ANOVA results. Only select those that showed a significant p-value (p < 0.05).
- Type & Correction: I'd recommend keeping the "Normal" type and "Tukey" correction, which are standard for ANOVAs.
- Interpreting Results: JASP will display a results table with all of the pairwise comparisons of conditions and will report a p-value for each. Any comparisons with significant p-values (p < 0.05) are considered to be statistically significantly different.
- Are Post Hoc Tests Necessary?
- Graphing Important Results:
- Results are generally considered "important" if they are either (1) central to your research questions and hypotheses and/or (2) report statistically significant findings. These are the graphs you'll generally see in a paper's results section.
-
Main Effects Graphs:
- For a statistically significant main effect (a significant p-value for a single fixed factor), you'll want to use the "Bar Plots" feature in JASP.
- Go to "Bar Plots": Go to the "Bar Plots" section.
- Select Significant Main Effect to Graph: Select the significant main effect on the left and select it for the "Horizontal Axis".
- Error Bars: Under "Display" check the "Error Bars" box and the "Standard Error" option.
-
Interaction Effects Graphs:
- For a statistically significant interaction effect (a significant p-value for a combination of fixed factors), you'll want to use the "Descriptives Plots" feature in JASP.
- Go to "Descriptives Plots": Go to the "Descriptives Plots" section.
- Select Interaction Effect Factors to Graph: For the two factors that are included in the significant interaction effect, select one for the "Horizontal Axis" and the other for "Separate Lines".
- Adjust Display: In the "Results" pane on the right, you can see your graph and expand the graph using the tab on the bottom right to make it less squished and easier to see.
- Error Bars: Under "Display" check the "Error Bars" box and the "Standard Error" option.
Reporting Results
Once you've run your statistical tests and graphed the important results, it's time to write up your results. Here are the necessary items to include for each test:
- NO statistically significant or important results: If you did not find a significant main effect or interaction effect, simply state that you did not find them, e.g., "When examining the influence of [independent variable(s)] on [dependent variable] we found no significant main effects nor significant interaction effects."
- YES statistically significant or important results: When you have statistically significant or important results to report, you'll need to provide:
- A Graph: Include the plot generated by JASP.
- Statistical test information: This includes:
- Test statistic: the test statistic (F for ANOVA, t for T-test, estimate - c - for regressions)
- Effect size: the effect size (η2 for ANOVA, Cohen's D for T-test, SE for regressions)
- P-value: the significance (p) value.
- Decimal places to report: I typically provide 2 decimal places for all values except for the p-value where I provide 3 decimal places (and sometimes η2 if it's very small).
- Example: "As shown in Figure X, we found that the [independent variable] had a significant influence on [dependent variable] (F = 10.00, η2 = 0.002, p = 0.034)."
-
Means and standard deviations: Once you have reported the significant effect, you'll want to provide the reader with the details of how different the groups are from one another with means and standard deviations (for categorical independent variables). For example, "Participants in [group 1] (M = 9.00, SD = 1.50) reported significantly higher [dependent variable] than those in [group 2] (M = 5.00, SD = 2.00)."
Note: If you need to find the mean and standard deviations for a main effect, you can select "Descriptives" from the top (next to ANOVA), select "Descriptive Statistics" and then select the dependent variable and fixed factor for which you want the means and standard deviations. JASP will then generate a table with the means and standard deviations for each condition within that factor.
- [If Applicable] Post Hoc Pairwise Comparisons: If you ran post hoc tests, you'll also want to report the results of those as well. Unlike for the main test, you'll only need to report the significant p-values. For example if I had a main effect where there were 3 experimental conditions, I might report the means, standard deviations, and pairwise comparisons like: "Post hoc pairwise comparisons reveal that participants in [group 1] (M = 9.00, SD = 1.50) reported significantly higher [dependent variable] than both those in [group 2] (M = 5.00, SD = 2.00, p = 0.040) and those in [group 3] (M = 4.00, SD = 1.05, p = 0.003). We found no statistically significant differences in [dependent variable] between participants in [group 2] and [group 3]."
- Support for Hypotheses: After reporting on the presence or absence of significant results, it is important to highlight whether these results either provide no support, partial support, or support for your hypotheses. For example, "This result provides partial support for H1 (human-likeness) that participants view a human-like robot as warmer than a mechanical robot."
Additional Tips
Changing the Reference Class
For tests like logistic regressions, the first group will become (by default) the reference class. This means that the other conditions will be compared to this first group. If you wish to compare the other groups to one another, you can change the reference group by:
- Selecting "Edit Data"
- Double-clicking on the variable name of interest
- Within the "Label Editor", click on the arrow buttons on the left to "Revers order of all labels"